Probabilistic Estimation of Network Size and
Diameter
Jorge C. S. Cardoso, Carlos Baquero and Paulo Sérgio Almeida
Abstract
Determining the size of a network and its diameter are important functions in
distributed systems, as there are a number of algorithms which rely on such
parameters, or at least on estimates of those values.
The Extrema Propagation technique
allows the estimation of
the size of a network in a fast, distributed and fault tolerant manner. The
technique was previously studied in a simulation setting where rounds advance
synchronously and where there is no message loss.
This work presents two main contributions. The first, is the study of the Extrema Propagation technique under asynchronous rounds and integrated in the Network Friendly Epidemic Multicast (NeEM) framework.
The second, is the evaluation of a diameter estimation technique associated with the Extrema Propagation.
This study also presents a small enhancement to the Extrema Propagation in terms of communication cost and points out some other possible enhancements.
Results show that there is a clear trade-off between time and communication that must be considered when configuring the protocol-a faster convergence time implies a higher communication cost.
Results also show that its possible to reduce the total communication cost by more than 18% using a simple approach.
The diameter estimation technique is shown to have a relative error of less
than 10% even when using a small sample of nodes.
Keywords: Aggregation; Network Size Estimation; Network Diameter Estimation; Probabilistic Estimation;
1 Introduction
Determining the size of a network is an important function in a
distributed system. There are a number of algorithms which rely on an
estimate of the network size, or that would at least benefit from such an
estimate, for example: distributed hash tables can take
advantage of having an estimate of the network size to adjust the size of
the routing table that each node keeps; gossip-based protocols
[1,2] can use an estimate of the network
size to better adjust the gossiping fanout parameter;
Although important, determining the size of a network, in a distributed
manner, is not trivial. Algorithms that do this should be fast, to cope with
high churn; fault-tolerant, to cope with link and node failures; and use a
small number of messages, in order not to impose a high overhead in network
bandwidth.
Another important network parameter is its diameter-the maximum
shortest-path length between any two pairs of nodes. Knowing the diameter,
or at least having an estimate of its value is important to configure, for
example, the time-to-live field on many protocols.
In a previous
work, [3,4] introduced
the Extrema Propagation technique, which allows the estimation of the size
of a network. This technique is fast because it produces estimates in a
number of steps close to the theoretical minimum; completely distributed,
because every node determines the estimate by itself; does not require
global identifiers; and tolerates message loss. Also, it is possible to
adapt it in order to have it produce an estimate of the network diameter.
However, the Extrema Propagation technique was originally studied in a
simulation setting where rounds advance synchronously and where there is no
message loss. In a real scenario, networks and nodes are often not
synchronous, some nodes may fail, links have different latencies and
messages may be lost in transit.
The purpose of this work is to:
- study the Extrema Propagation technique under
asynchronous rounds;
- extend the technique in order to have it produce an
estimate of the network diameter;
- evaluate an optimization to the original message size of the Extrema
Propagation technique.
In order to study the technique in a more realistic setting, we adapted and
integrated it in the Network Friendly Epidemic
Multicast [5] (NeEM) framework1
since NeEM could also benefit from the estimates produced by Extrema.
This paper is organized as follows: Section II describes
some algorithms that perform data aggregation across a network and compares
them to the algorithm used in this paper. Section III describes
the NeEM software that was modified and used in this work.
Section IV gives an overview of the Extrema Propagation
technique for estimating the size of a network and how it can be adapted to
estimate the network's diameter. Section V describes
the general experimental procedure and the various experiments performed.
Section VI presents the results from the experiments and,
finally, Section VII concludes.
2 Related Work
There are numerous algorithms for estimating the size of a network or, more generally, for performing data aggregation across a network.
Some algorithms, more directly related to this study are described next.
The work in [6]
presents two methods for estimating the size of a network: the Hops Sampling
and the Interval Density methods.
In the Hops Sampling method, an initiator node starts the process by sending
a message to gossipTo nodes. The message contains a hop count that is
incremented prior to being sent. Messages sent from a node p are only sent
to nodes from which p has not received any message. After gossipResults
rounds have elapsed the initiator collects a sample of hop counts from
gossipSample other nodes and uses the average of the hop counts as an
estimate of log(N). However, contrary to the Extrema technique, this
methods requires that each node is able to maintain a membership list chosen
uniformly at random from the system. Also, only the initiator node will have
an estimate of the size.
In the Interval Density method, the process identifiers are hashed and
mapped to a point in the interval [0, 1]. The initiator node then
calculates the number of processes, X, in an interval I < 1. The estimate
of the network size is then calculated as X/I. In order to collect the
samples (identifiers) the authors propose piggybacking messages from a
membership maintenance protocol with information about the interval used in
the estimates. In this method, the difficulty is in defining the interval
I, since it depends on the network size N.
Push-sum [7] introduces a different approach for computing sums
and averages and can provide high precision estimates after a sufficient
number of rounds. Each node keeps two variables: s and w initialized to
xi (the contribution of node i to the sum) and 1 (the initial weight
of this contribution), respectively. In each round, nodes select another
node at random and send [s/2] and [w/2] to that node (and
keep [s/2] and [w/2] to themselves). Each pair of s and
w received by a node is added to the current ones. In each round, the
estimate of the average is given locally by [s/w]. After a number
of rounds all nodes converge to the same result, the global average.
The push-pull algorithm [8] introduces a similar approach
but in this case information is exchanged in a symmetric manner. A node A
randomly selects another node B to exchange its value va and sends him
a Push message with va. Upon receipt of a Push message, node B will send
a Pull message with its own value vb to the node A. After receiving a
Push or a Pull message both nodes will update their value v:
This technique (as well as the one by [7])
is sensitive to message loss. Both algorithms require that the total system
"mass" is kept constant. A lost message will break this requirement. In
Extrema, message loss does not affect in the long run the result of the
algorithm since "each message is made obsolete by subsequent
ones: if a message from A to B containing
vector x is lost, a subsequent message will have
content y, where y £ x (in pointwise order)" [4].
3 NeEM
NeEM - Network Friendly Epidemic Multicast [9] - is an
epidemic multicast protocol which relies on connection-oriented transport
connections (TCP/IP) in order to take advantage of the built-in end-to-end
congestion control.
When gossiping, NeEM combines different strategies. If the message to be
gossiped is small (smaller than a predefined value), then it is always
pushed until its time-to-live (TTL) has expired. If the message is large,
then it is pushed during PushTTL rounds, and then advertised until
TTL has expired. Both TTL and PushTTL are preconfigured.
NeEM has been implemented in Java2
and its main components are:
Multicast channel Provides applications with an interface for
joining and leaving the network and for receiving and multicasting messages.
In order to join the network, a peer needs to know, at least, another peer
already in the network which will act as the entry point. A peer is
identified by a randomly generated universally unique identifier (UUID).
Gossip Layer Takes care of gossiping messages using the strategies
described earlier. Keeps a cache of messages so that it can respond to
pulling by peers. It also keeps a list of known message advertisers in order
to pull advertised messages. Messages are identified by a randomly generated
UUID. When gossiping, it randomly selects Fanout peers from the partial
membership kept by the overlay layer.
Overlay Layer Manages the overlay network and a partial membership list. The overlay tries to maintain a fixed number of peers in the local membership list (in NeEM's implementation this is also called Fanout but is different from the gossip Fanout). Membership is dynamic as the overlay will shuffle peers periodically, by randomly selecting two peers from the current list and informing them of one another. Those peers will then randomly decide if they add the other one to the current list, eventually purging another.
Transport Layer The transport layer manages TCP connections between
peers, maintaining queues of messages per connection.
NeEM's structure can be seen as layer stack as depicted in Figure 1.
| Application |
| Multicast Channel |
| Gossip |
| Overlay |
| Transport |
Figure 1: NeEM's layer stack.
NeEM is implemented in a way that allows easy integration of other protocols. The transport layer allows different handlers to be registered and will demultiplex messages based on a logical port and deliver them to the appropriate handler.
Peers join a NeEM group by contacting another known peer, however, even if all peers join through the same known peer, the overlay topology will always tend to a random network, since NeEM shuffles peers periodically by performing a random walk.
4 Extrema Propagation
The Extrema Propagation technique is a probabilistic data aggregation technique
which works as follows.
"[...] if we generate a random real number in each node using a known
probability distribution (e.g. Gaussian or exponential), and aggregate
across all nodes using the minimum function, the resulting value has a new
distribution which depends on the number of nodes. The basic idea is then to
generate a vector of random numbers at each node, aggregate each component
across the network using the pointwise minimum, and then use the resulting
vector as a sample from which to infer the number of nodes (by a maximum
likelihood estimator)." [4]
Basically, each node generates a vector of K exponentially distributed
random numbers (Minimums vector in the rest of this
document) and sends it to its neighbours. Each node aggregates and resends
vectors from neighbours using the pointwise minimum-an idempotent
operation. After convergence (determined by each node, after a predefined
number of rounds have passed without changing the Minimums vector) the
resulting vector-with the K global minimums-can be used to estimate
the number of nodes in the network.
The technique's focus is on speed not on accuracy, since aiming at very low
errors would need very large vectors.
For example, an error of 1% with 95% confidence
would require
|
K = 2+ |
æ
è
|
1.96
error
|
ö
ø
|
2
|
=2+ |
æ
è
|
1.96
0.01
|
ö
ø
|
2
|
=38418. |
|
A 10% error, however, only requires K=387.
In order to optimize the message's size, the technique encodes the values
using only the exponent of its representation (mantissa, exponent).
Furthermore, for most cases only 5 bits need to be used to represent the
exponent. This means that a vector with K=387 needs only
Convergence is determined by a predefined number of rounds without changes
(no news rounds, T) occurring in the Minimums vector. The
minimum number of no news rounds to wait depends on the network topology and
size, but a safe value can be used to accommodate, at least, a wide range of
expected network sizes.
The technique was studied by simulating runs (with synchronous rounds) for
several values of K and for different types of networks (geometric 2D,
random and preferential attachment networks) and sizes (100, 1000 and
10000 nodes). For each run, the average and maximum number of rounds
needed to converge where recorded, as well as the maximum number of rounds
with no news.
Results show that, for random and preferential attachment networks, T=5 is
sufficient when K=10 or K=100 and T=4 is sufficient when K=1000.
For geometric 2D networks, K should be 100 or 1000 since K=10 would
lead to a large overhead of the no news rounds over the average number of
rounds needed to converge. For K=100 a T=19 would suffice and for
K=1000, T=11. These are all conservative values to ensure that all
nodes have converged.
The Extrema Propagation technique is resilient to message failures: if a
message (with vector x) from node A to node B is lost, in the next
round, it will be superseded by another message (vector x¢) with x¢ £ x.
The synchronous version of the basic algorithm, though, does not cope with
message loss since nodes are made to wait for all neighbours. A single
message loss would deadlock the system. It is easy to adapt the algorithm
and cope with message loss. As suggested in [4], the algorithm can
be modified to, instead of waiting for every neighbour, forever:
- Wait for all neighbours, until a timeout occurs (ONLY_TIMEOUT
strategy).
- Wait for all neighbours minus F (ONLY_F strategy).
- Wait for all neighbours, until a timeout and then wait for all minus F (TIMEOUT_PLUS_F strategy).
For sake of completeness, there is one more variant that can be used:
- Wait for all neighbours minus F, until a timeout occurs (F_PLUS_TIMEOUT) strategy.
These variants, besides allowing to cope with message failures, make the
algorithm more robust in face of slow links. In the original algorithm,
although not fatal, a single slow link would slow down the entire system. By
introducing timeouts and the possibility of not waiting for every neighbour,
a slow link can be regarded as a message failure. This means that the
algorithm may not wait for nodes behind slow links, thus not slowing the
entire round. Messages sent on slow links will arrive and be accounted for
in the following rounds.
In Section V, one discusses experimental results
that can guide the proper configuration of the timeout and F in practical
asynchronous settings.
4.1 Diameter Estimation
The Extrema Propagation technique can be augmented to also give an estimate
of the network diameter: for each entry in the Minimums vector of
the Extrema technique, one adds a corresponding entry in a new vector
Hops. The Hops vector is initialized at every node with
zeroes. Every time that a node updates the Minimums vector because
it has received a smaller value from one of its neighbours, it also updates
the corresponding entry in the Hops vector with the value received
from that neighbour. The Hops vector is also updated when a node
receives a smaller entry in the Hops vector for an equal value in
the Minimums vector (meaning that a shorter route to that minimum
was found). A copy of the Hops vector, with values increased by
1, is sent along with the Minimums vector, to every neighbour, in
each round.
After convergence, in each node max(Hops) is an estimate of its
eccentricity and the network diameter can be determined across the
network by aggregating the maximum of these eccentricities. In particular, if
one of the minimums was generated in a periphery node the final diameter
estimate will be exact.
4.2 Message Size Optimization
The standard message in the Extrema Propagation is a message with K
values, 5 bits each, corresponding to the minimums vector that each node
stores. This vector is updated when one (or several) new minimums is
received, but is sent in every round even if it is equal to the last vector
sent. Also, the same vector is sent to every neighbour, regardless of what
that neighbour already "knows".
This means that potentially old information is sent in each message. A
simple way to mitigate this inefficiency is to store the last vector that
each neighbour sent and use it as a way to determine what needs to be sent
to that neighbour in the next round. This way, messages are differentiated
by neighbour. A message only needs to contain values that are smaller than the ones in the
current copy of that neighbours' vector.
Instead of sending K*5 bits, each node can send only N pairs of
(index,value) entries - the number of values smaller than the ones in
the current copy of that neighbour's vector. In order to correctly
interpret the message, the receiving node needs to know also how many pairs
were sent. This message will only save bandwidth if the number of pairs
(index, value) is sufficiently small. If not, the standard format should
be used instead.
Optimizing the message size in this way means trading off bandwidth usage
for memory usage since each node now has to keep the last vectors received
from each neighbour.
The final message structure uses one of two types:
| Type 0 | 1 bit |
| Number of pairs (N) | ceil(log2(K)) bit |
| (Index, Value) pairs | (ceil(log2(K)) + 5)*N bit |
|
|
| Type 1 | 1 bit |
| Minimums vector | K*5 bit |
In order for Type 0 to be used it must save bandwidth, which means that:
|
ceil(log2(K)) + (ceil(log2(K))+5)*N £ K*5 |
| (1) |
This results in:
|
N £ |
K*5-ceil(log2(K))
ceil(log2(K))+5
|
|
| (2) |
5 Experiments
The evaluation of the integration of the Extrema Propagation technique in
NeEM was done using
Modelnet [10] as the simulation
platform.
The following is a description of the general simulation setup and
procedures that were used.
The experiment network consisted of two computers - one emulator and one
application host with the following characteristics:
Emulator:
- Pentium 4 CPU at 3.40 GHz
- 2 Gb RAM
- 3Com Etherlink XL 10/100 PCI TX NIC
Application host:
- Pentium 4 CPU at 3.40 GHz
- 1.5 Gb RAM
- Broadcom NetXtreme Gigabit Ethernet
Modelnet's graph file was created with the following command:
inet -n 3037 | inet2xml -l -p 800 \
among 50 stubs min-client-stub 1000 1 0\
max-client-stub 1000 50 0
Which creates a network of 3037 nodes (the minimum for inet) and 800
clients3 attached among 50
stubs4. The command also
specifies the bandwidth of the client-stub link to be 1000 kbps, latency
between [1, 50] milliseconds and no packet drops. All the other link types
have default parameters, except for latency which is inferred from the node
distance.
The experiments were controlled by a set of shell scripts that invoked specific JMX
(Java Management Extensions)
functions on a Java class that represented the experiment. This class was responsible for loading all instances of the modified multicast channel, connecting them, starting the Extrema protocol and wait for it to finish.
The process of running an experiment consisted of:
- Loading the main experiments class;
- Adding N nodes by randomly picking N virtual node addresses from the set assigned to the machine;
- Configuring each node according to the experiment settings;
- Randomly connecting nodes among themselves;
- Letting overlay network settle for a few seconds;
- Starting the extrema protocol on one randomly chosen node;
- Waiting until a preconfigured number of rounds had elapsed;
- Stopping the experiment;
- Saving the log files.
The log files recorded the following:
- Message send timestamp;
- Message receive timestamp;
- After each round: round number, current Minimums vector, current Hops vector, timestamp, number of total sent messages.
Running several instances of the protocol on the same machine has two potential bottlenecks: the CPU and the network interface.
In the case of our experiments, the communication load of each node was
fairly small so bandwidth was not a problem. On the other hand, running
several threads of the protocol in the Java virtual machine turned out to be
very CPU intensive.
The latency between nodes, for an increasing number of nodes and for different configurations, was measured and the results showed that, for some configurations and number of nodes, the latency between nodes increased beyond that imposed by Modelnet (and the message processing overhead at the machine).
This restriction led to the use the following maximum values in most of the experiments:
K=10, MaximumNumberOfNodes=75 and OverlayFanout=10.
In all experiments that used this modified NeEM implementation, the network topology used was the one that emerges through NeEM's automatic shuffling of peers: an approximately random network.
5.2 Timeout and F
In order to determine the best combination of Timeout and F to use in the NeEM Extrema protocol, several combinations were tested.
The base values for the tested parameters were Timeout=200, F=0.8 (in the rest of this document, F is the fraction of neighbours to wait for) and the F_PLUS_TIMEOUT strategy.
For each of the three parameters, several values were tested, maintaining the other parameters with the base values. This led to the variations enumerated in Table I.
| |
| Timeout | Strategy | F |
| 200 | F_PLUS_TIMEOUT | 0.8 |
| 400 | F_PLUS_TIMEOUT | 0.8 |
| 600 | F_PLUS_TIMEOUT | 0.8 |
| 400 | ONLY_TIMEOUT | 0.85 |
| 400 | TIMEOUT_PLUS_F | 0.8 |
| 4006 | ONLY_F | 0.8 |
| 400 | F_PLUS_TIMEOUT | 0.5 |
| 400 | F_PLUS_TIMEOUT | 0.9 |
Table 1: Configurations for the NeEM Extrema implementation.
|
| |
For each configuration, 100 runs were executed and the log files were analyzed to determine the number of rounds, and the total time until convergence of the Minimums vector.
5.3 Diameter Estimation
5.3.1 Relative Error
In order to estimate the expected accuracy of the diameter estimation technique, we simulated the method using three different network topologies (random networks, preferential attachment networks and random geometric 2D networks) and sizes (50, 500 and 5000 nodes networks).
For each topology and size, 150 graphs were generated.
For random and preferential attachment graphs, average degrees of 5, 10 and 15 were used. For each, 50 graphs were created.
For 2D graphs, 1.3, 1.6 and 1.9 relative radius were used and 50 graphs were created for each.
For each graph, three different values of K were simulated, 50 times each.
For a graph of size N, the simulation consisted of:
- Generating K random exponentially distributed values coded according to [4]
for each node in the graph;
- Calculating the K global minimums across the graph;
- Determining the nodes that generated each of the global minimums;
- For each global minimum, calculating the shortest paths from all nodes to the nodes that generated the minimum and taking the minimum shortest path length;
- Calculating the estimated diameter as the maximum of the previous values across all nodes.
For each graph, the diameter, radius and the eccentricities of all nodes were also calculated and recorded. This allowed to calculate the error in the diameter estimation and percentage of nodes in the periphery of the graph.
5.3.2 Rounds to converge
Convergence of the Hops vector cannot be determined by examining the log files, in normal circumstances. This happens because the overlay topology changes over time (NeEM "shuffles" peers periodically).
In order to get a rough idea of how long it might take for the Hops vector to converge in a static topology, a different test was performed. Before starting the Extrema protocol, all nodes were configured to disable shuffling, thus freezing the current overlay topology. A snapshot of the topology was then taken and recorded in a graph file for posterior analysis.
Two configurations were tested: one in which rounds are fast, because only half the neighbours are required in order to advance; and one in which rounds are slow, because nodes wait for every neighbour until a timeout and then proceed after a fraction of neighbours have responded. This corresponded to the following parameters:
- Fast rounds: TimeOut=400, Strategy=F_PLUS_TIMEOUT, F=0.5.
- Slow rounds: TimeOut=400, Strategy=TIMEOUT_PLUS_F, F=0.8.
For each value of K Î {10, 100}, 100 runs were executed and recorded.
The log files were analyzed (specifically the Hops vector) to determine the error in the diameter estimation in the rounds after convergence of the Minimums vector. The overlay graph file served as reference for the true diameter of the network.
5.4 Message Optimization
In order to evaluate the message size improvements presented in Section IV-B, the implementation of Extrema in NeEM was extended in order to log, in each round, the number of values in the Minimums vector that needed to be sent to each neighbour, based on the comparison of the current Minimums vector and the last vector received from each neighbour. The same was done for the Hops vector.
The analysis was done considering two cases separately: messages without the Hops vector (only size estimation would be performed); and messages with the Hops vector (both size and diameter estimation would be performed).
The message size improvement procedure for the message with the Hops vector is analogous to the one presented in Section IV-B.
Five hundred runs were executed with parameters: Timeout=400, F=0.5, Strategy=F_PLUS_TIMEOUT and K=10. Only networks with 65 nodes were tested.
6 Results and Discussion
6.1 Timeout and F
The average number of rounds until convergence for the different combinations is shown in Figure 2.
Figure 2: Average number of rounds ellapsed until convergence.
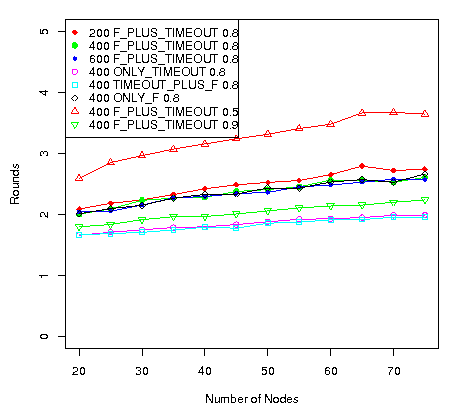 The plots on Figure 2 indicates, from the number of rounds perspective, that:
- Trying to receive all possible messages before advancing round produces the best results. This is what happens in the ONLY_TIMEOUT and the TIMEOUT_PLUS_F settings.
- Waiting for only half of the neighbours is the worst setting. Clearly, in that setting, the timeout is not being triggered, meaning that rounds are advancing with only half the messages received increasing the number of needed rounds.
- A timeout of 400 milliseconds seems to be enough for most nodes to communicate, since the ONLY_TIMEOUT setting is very similar to the TIMEOUT_PLUS_F with F=0.8. This means that at least 80% of the neighbours communicate within the 400 milliseconds interval.
Figure 3 shows the average time a node needs to achieve convergence. It indicates, from the total time perspective, that:
- Slower rounds, although implying less number of rounds, produce worst results. This can be seen from the top lines, which correspond to the better settings from the number of rounds point of view.
Figure 3: Average time until convergence.
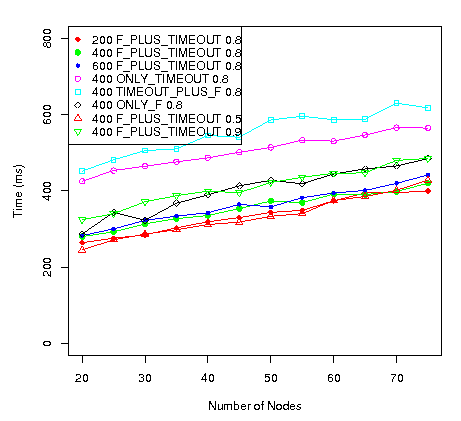 Comparing both Figures, its apparent that there is a trade-off between time and communication (the number of rounds is an indirect measure of messages sent): faster convergence means higher communication cost.
6.1.1 No news Rounds
Although convergence of the Minimums vector can be determined by examining the log files, it cannot be determined by individual nodes. Nodes have to assume convergence after a predefined number of rounds have elapsed without changes in the Minimums vector.
In the previous tests, the maximum number of no news rounds (NN) observed were the following:
| Timeout | Strategy | F | NN |
| 200 | F_PLUS_TIMEOUT | 0.8 | 5 |
| 400 | F_PLUS_TIMEOUT | 0.8 | 3 |
| 600 | F_PLUS_TIMEOUT | 0.8 | 4 |
| 400 | ONLY_TIMEOUT | 0.8 | 2 |
| 400 | TIMEOUT_PLUS_F | 0.8 | 2 |
| 400 | ONLY_F | 0.8 | 4 |
| 400 | F_PLUS_TIMEOUT | 0.5 | 7 |
| 400 | F_PLUS_TIMEOUT | 0.9 | 3 |
Although the values are fairly similar, it appears that faster rounds lead to a larger NN value than slower rounds.
6.2 Diameter Estimation
6.2.1 Relative Error
Table II summarizes the result of the simulation.
| | | | Average | Average |
| Network | Network | Average | | Absolute | Relative |
| Type | Size | Diameter | | Error | Error |
| K=10 |
| 2d | 50 | 9.9 | | 0.5997 | 6.03% |
| Attach | 50 | 3.0 | | 0.1116 | 3.68% |
| Random | 50 | 2.4 | | 0.0340 | 1.05% |
| 2d | 500 | 35.1 | | 3.2631 | 9.43% |
| Attach | 500 | 3.7 | | 0.3396 | 8.14% |
| Random | 500 | 4.0 | | 0.4376 | 10.10% |
| K=100 |
| 2d | 50 | 9.9 | | 0.0117 | 0.12% |
| Attach | 50 | 3.0 | | 0.0001 | 0% |
| Random | 50 | 2.4 | | 0.0017 | 0.06% |
| 2d | 500 | 35.1 | | 0.6669 | 2.00% |
| Attach | 500 | 3.7 | | 0.1588 | 3.73% |
| Random | 500 | 4.0 | | 0.1081 | 2.65% |
| K=1000 |
| 2d | 50 | 9.9 | | 0 | 0% |
| Attach | 50 | 3.0 | | 0 | 0% |
| Random | 50 | 2.4 | | 0 | 0% |
| 2d | 500 | 35.1 | | 0.0116 | 0.03% |
| Attach | 500 | 3.7 | | 0.0048 | 0.11% |
| Random | 500 | 4.0 | | 0.0019 | 0.05% |
Table 2: Diameter estimation accuracy
Results indicate that the diameter is estimated with a maximum relative error of about 10%, when K=10. However, increasing K to 100, reduces this error to less than 4%.
From the absolute error perspective, random geometric 2D networks are clearly the worst type of network for the diameter estimation technique. In these networks, the number of nodes in the periphery is almost always very low.
This leads to the highest average absolute error, from all types of networks.
However, since geometric 2D networks also have the highest diameter, the relative error ends up being in the same order of magnitude (or very close) for all network types.
6.2.2 Rounds to Converge
Figure 4 shows the average absolute error in the diameter estimation as a function of the number of rounds after convergence of the Minimums vector, for different values of K.
Figure 4: Additional rounds needed to estimate the diameter.
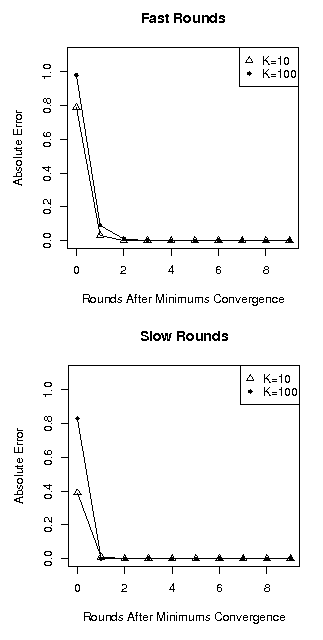 In both configurations, it is apparent that the Hops vector (used to estimate the diameter) takes more time to converge than the Minimums vector. This happens because some shorter paths are slower than longer paths. So it may happen that a hop count is substituted by a lower count that came from a shorter, slower path. However, the same node may already have the final Minimums vector.
Slower rounds, in which nodes wait a long time before advancing, tend to mask this effect since nodes on fast paths will still have to wait a long time before advancing.
In both configurations, it is apparent that the Hops vector (used to estimate the diameter) takes more time to converge than the Minimums vector. This happens because some shorter paths are slower than longer paths. So it may happen that a hop count is substituted by a lower count that came from a shorter, slower path. However, the same node may already have the final Minimums vector.
Slower rounds, in which nodes wait a long time before advancing, tend to mask this effect since nodes on fast paths will still have to wait a long time before advancing.
6.3 Message Optimization
Table III summarizes the results and shows the average message size reduction in a run of the algorithm, per node, for different values of T, with and without the Hops vector included in the message.
| Without Hops vector |
| T | Average | Standard | Average vector |
| reduction | deviation | length |
| 0 | 3.37% | 1.38% | 7.94 |
| 1 | 8.62% | 1.26% | 6.88 |
| 2 | 13.91% | 1.03% | 5.94 |
| 3 | 18.34% | 0.86% | 5.19 |
| 4 | 21.85% | 0.75% | 4.61 |
| 5 | 24.66% | 0.67% | 4.14 |
| 6 | 26.95% | 0.62% | 3.77 |
|
| With Hops vector |
| T | Average | Standard | Average vector |
| reduction | deviation | length |
| 0 | 7.97% | 2.12% | 7.95 |
| 1 | 15.63% | 1.95% | 6.92 |
| 2 | 23.18% | 1.61% | 5.98 |
| 3 | 29.44% | 1.34% | 5.24 |
| 4 | 34.40% | 1.15% | 4.65 |
| 5 | 38.38% | 1.02% | 4.18 |
| 6 | 41.62% | 0.93% | 3.80 |
Table 3: Average message size reduction achieved using the improvements presented in Section IV-B
.
As expected, the overall message size reduction increases as T increases. This happens because, near the final rounds of the algorithm, almost all nodes have the final vectors and their neighbours know this. This allows each node to send only a few values to each neighbour instead of the total K values.
When considering the combined techniques for size and diameter estimation (message with Minimums and Hops vector), the reduction in message size is more pronounced than when considering only the size estimation (only Minimums vector). This happens because, in our implementation, each value in the Hops vector was coded using 8 bit, which in most cases would be too conservative a value. This leads to a greater reduction in size when using the improved message format.
The average vector length column in Table III shows the average number of values sent by each node to each neighbour (K was set to 10). With three safe-guard rounds (T=3) only about five values out of ten have to be sent, on average. For the two cases (only Minimums vector and Minimums plus Hops vector) the average vector length is very similar (which might contradict the difference in the values of the average reduction column, but that was explained in the previous paragraph).
7 Conclusions
This article presented a study on the behaviour of the Extrema Propagation
technique on asynchronous scenarios, with different configuration settings.
It also presented and evaluated a novel diameter estimation technique based
on the Extrema Propagation technique.
When arbitrary delays and failures are allowed in the system model, the
original Extrema Propagation algorithm has to be slightly modified. Instead of
waiting for every neighbour, which could lead to deadlocks, each node should
only wait for a fraction of its neighbours, wait until a timeout occurs, or
a combination of the two.
Results show that there is a clear trade-off that must be considered. Fast
rounds - rounds in which each node advances rapidly either because they
wait for a small fraction of the neighbours or because a small timeout was
configured - lead to a faster convergence of the Minimums vector
and hence a faster estimation of the network size. However, fast rounds also
lead to a larger number of rounds needed, which is an indirect measure of
the number of messages exchanged. Slow rounds - in which each node waits for
a large number of neighbours - lead to slower estimation but also to a
smaller number of messages exchanged. The trade-off between communication
cost and time must the considered.
Although the Extrema Propagation technique is already very efficient in
terms of number of steps, since it come very close to the theoretical
minimum of Diameter steps (with only a small constant increase due to the
extra safe-guard rounds needed), it is still amenable to improvements in
the size of the message that is used. The proposed improvement described in
section IV-B shows that its possible to reduce the total
communication cost using a simple approach. Even without considering
additional safe-guard rounds, there is an average reduction of 3.4% in
message size when considering only the basic Extrema Propagation technique
and almost 8% when combining the diameter estimation technique. When
additional safe-guard rounds are used, the savings are even more substantial,
rising to 18% and 29% for 3 aditional safe-guard rounds.
A diameter estimation technique based on the Extrema Propagation was
presented and evaluated. The technique takes advantage of the generation of
a fixed number of global minimums that act as a node sampling means to
calculate the eccentricities of those nodes. If one of the "sampled" nodes
is a peripheral node and enough rounds are allowed to pass, then the exact
network diameter can be calculated. The accuracy can be adjusted by the
parameter K, the number of minimums to generate. Results from
simulations show that even with a very small number of minimums (K=10), the
relative error in the estimation is only about 10%.
8 Aknowledgments
The authors would like to thank José Orlando Pereira and Nuno Carvalho
for their help in the NeEM integration and testing. This work has been
partially supported by FCT and POCI 2010, co-funded by the Portuguese
Government and European Union in the FEDER Program.
References
- [1]
-
P. Eugster, S. Handurukande, R. Guerraoui, A. Kermarrec, and P. Kouznetsov,
"Lightweight probabilistic broadcast," 2001. [Online]. Available:
citeseer.ist.psu.edu/eugster01lightweight.html
- [2]
-
A. J. Ganesh, A.-M. Kermarrec, and L. Massoulie, "Peer-to-peer membership
management for gossip-based protocols," IEEE Transactions on
Computers, vol. 52, no. 2, pp. 139-149, 2003.
- [3]
-
C. Baquero, P. Almeida, and R. Menezes, "Extrema propagation: Fast distributed
estimation of sums and network sizes," Universidade do Minho, Tech. Rep.,
May 2006.
- [4]
-
C. Baquero, P. S. Almeida, and R. Menezes, "Fast estimation of aggregates in
unstructured networks," in International Conference on Autonomic and
Autonomous Systems (ICAS), Valencia, Spain, 20/04/2009-25/04/2009. http://www.computer.org: IEEE Computer Society,
april 2009.
- [5]
-
"Neem - network-friendly epidemic multicast,"
http://neem.sourceforge.net/index.html.
- [6]
-
D. Psaltoulis, D. Kostoulas, I. Gupta, K. Birman, and A. Demers, "Practical
algorithms for size estimation in large and dynamic groups," University of
Illinois, Urbana, Tech. Rep., 2004.
- [7]
-
D. Kempe, A. Dobra, and J. Gehrke, "Gossip-based computation of aggregate
information," Foundations of Computer Science, 2003. Proceedings. 44th
Annual IEEE Symposium on, pp. 482-491, October 2003.
- [8]
-
M. Jelasity, A. Montresor, and O. Babaoglu, "Gossip-based aggregation in large
dynamic networks," ACM Trans. Comput. Syst., vol. 23, no. 1, pp.
219-252, 2005.
- [9]
-
J. Pereira, L. Rodrigues, M. J. Monteiro, R. Oliveira, and A.-M. Kermarrec,
"Neem: Network-friendly epidemic multicast," in Proc. 22nd
International Symposium on Reliable Distributed Systems, IEEE. Florence, Italy: IEEE Computer Society, October
2003.
- [10]
-
2 plus
43 minus
4
A. Vahdat, K. Yocum, K. Walsh, P. Mahadevan, D. Kostic, J. Chase, and
D. Becker, "Scalability and accuracy in a large-scale network emulator," in
Proceedings of 5th Symposium on Operating Systems Design and
Implementation (OSDI), December 2002. [Online]. Available:
http://www.cs.ucsd.edu/ vahdat/papers/modelnet.pdf
- [11]
-
2 plus
43 minus
4
D. Becker and K. Yocum, "Modelnet howto," Duke University., Tech. Rep., 2003,
http://modelnet.ucsd.edu/howto.html. [Online]. Available:
http://modelnet.ucsd.edu/howto.html
Footnotes:
1NeEM is
a software framework for group communication based on gossip protocols.
2See the project's sourceforge web page: http://neem.sourceforge.net/index.html.
3A client node in Modelnet's terminology is an edge node
in the virtual network corresponding to a computer attached to the wide area
internet [11,p. 10].
4A stub is a gateway for client nodes to access the
network [11,p. 10].
5The ONLY_TIMEOUT strategy does not take F into account.
6The ONLY_F strategy does not take Timeout into account.
Published originally in the Fourth Latin-American Symposium on Dependable Computing:
bibtex
Send comments to: 
December 4, 2009
